Do You Know the Spill Risk at Your Facility?
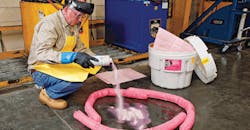
Almost every facility will experience some type of spill. Whether it is fuel leaking at a fuel station, oil leaking from a machine, an overflowing drain or a chemical or liquid leaking from a container, spills can be a slip hazard, an exposure hazard, a corrosive hazard… But do you know if your facility is at risk of a spill or how to reduce the possibility of a spill?
While the data gathering takes only minutes for a facility, powerful new algorithm from New Pig performs more than 600 physics-driven calculations for each liquid area to help facilities understand their own specific spill risks and the steps necessary to reduce risk. A new analysis shows that 94 percent of facilities have at least one critical spill risk, and many facilities that believe they are prepared significantly are underprepared for even incidental spills.
The algorithm asks six simple questions per area and takes less than 3 minutes per area to gather data. Questions include type of area (e.g. battery storage, fuel station), volume of the largest liquid container and the primary types of liquids stored or used in this area (e.g. water-based, corrosives.) When completed, the worksheet is emailed or texted to New Pig. A comprehensive written report of nine risk factors in each area and potential spill diameters is provided in a few days. The report includes a view of spill risks across entire facility and exact steps to take to aid in compliance, and companies do not have to be New Pig customers to utilize the algorithm and receive a report.
“Our intent was to provide physics-based guidance to facilities where regulations leave off,” said Andy James, New Pig’s director of advanced experience. “Trying to follow vague regs that require a spill kit with ‘sufficient quantities’ of absorbents and spill kits ‘in areas where spills, leaks or ruptures may occur’ [29 CFR 1910.120(j)(1)(vii)] leaves facilities open to inspector interpretation. We find that when provided with actual spill data, facilities are eager to take the steps to meet more a more helpful, meaningful guidance.”
In addition, “Improvement Paths” are created for each area to show how exactly risks will be reduced by taking the recommended steps. For example, the algorithm will describe the recommended total absorbency for the area, the maximum distance spill supplies and drain sealing supplies can be from the liquid area, among other factors. Also, for users who send photos of their areas, “application blueprints” may be included to show specific applications discussed in the Improvement Path.
EHS Today had a few questions about the new algorithm for Andy James, New Pig’s director of advanced experience, who created it.
EHS Today: What is the Spill Algorithm from New Pig Corp.? What is its purpose?
Andy James: We created the Spill Risk Algorithm to help facilities understand nine spill risks present in each area of their facility. Its purpose is that we have seen over the years was that regulations tend to be very vague, and use language like “sufficient quantities” of absorbents and spill kits “in areas where spills, leaks or ruptures may occur.” It would be similar to the IRS saying, "Pay an appropriate amount of taxes.” Not so helpful, and a gigantic gray area.
For facilities, it's a recipe for frustration, because the tactics to comply are so far removed from the language of the regs. We know that reality, and wanted to do something about it.
EHS Today: Can you tell my readers a little about the spill algorithm? How and why it was created and how long it took to get it to this stage?
Andy James: In a nutshell, it eliminates “eyeballing” an area, instead applying black and white physics. A spill of a given liquid on a given slope will behave similarly in any facility in the world, period. It’s going to follow laws of physics and those laws are replicable anywhere.
So, knowing that, the algorithm looks at your largest container in a given area, and calculates how far it would spread on different slopes, because we also know truly flat floors are surprisingly rare in facilities. Then, knowing how far that spill could reach, it looks at the nearest escape point, like a drain, and looks at the likelihood that the spill would reach that escape point. Then it layers in things like the classes of liquids present, what response supplies are available, how accessible they are, etc. The output is that we can then tell you definitively how your area falls on a spectrum of these nine risks, everything from Drain Risk to Spill Kit Distance to Response Pressure.
I think, more importantly, it doesn’t stop there and leave you to try to figure out how to fix it. The second half of the report then tells you area by area, how many gallons of absorbency, where to locate it, if you need to increase visibility and the exact steps you need to take to significantly reduce those risks. It took about a year to really button down the algorithm, and it took about another year of testing it in the real world. Response from users has been fantastic. I personally feel like we're really moving understanding out there in a meaningful way to benefit facilities.
EHS Today: What types of data does the Spill Algorithm use? What data/information should users have on hand before they start the process?
Andy James: The algorithm does the work, so it’s very quick for the facility, less than 5 minutes per area. No math or conversions for the user. We have a worksheet that asks a total of six questions about the classes of liquid in the area, such as largest container, and asks you to take four distance measurements. That’s all we need.
I do always encourage facilities to not “guess from their desk” about distances, but to go to the area and take the measurements, because our report can only be as accurate as the data. There are also a lot of liquid areas that tend to be overlooked in a facility, and this process is especially helpful for getting them on the facility’s radar.
EHS Today: Do you use actual photos from the facilities being analyzed?
Andy James: We do love photos, because it gives us a little context, and we do derive some Obstruction Factors from them to really dial in a couple risks. But, we do reports all the time for facilities that don’t allow photos, and you receive all of the same results.
EHS Today: What, in your opinion, are some of the key areas on which users should focus when reviewing their report?
Andy James: We like summarizing and highlighting the highest risks, so we create a one-page Risk Map that shows every area in the facility, current risks and how they would be reduced. That tends to be a great overview to prioritize where to focus.
While the front end of the report “shows the math,” the second half is very specific as to steps to take by area. It “bakes in” all of those risks, so you don’t have to worry about us treating 55 gallons of water and 55 gallons of sulfuric acid the same way. It takes it all into account, and shows you exactly what you can do, area by area.
EHS Today: How should they use the information in this report?
Andy James: There are many different ways, but the two most significant are making sure that they have appropriate spill response supplies for each area, and appropriate training for employees. When we see the risks and the types of liquids and settings at a facility, it’s an easy step to recommend areas of potential training. I truly see supplies and training as inseparable, because you could have pallets of spill kits, but they don’t deploy themselves. You can have the most highly-trained employees in the world, but they can’t do anything without appropriate spill response supplies.
EHS Today: Is the Spill Algorithm up and running? If not, when do you plan to launch it?
Andy James: It certainly is. Email [email protected] and we’ll get you up and running. We actually have six versions of the algorithm: two English (standard and metric), Spanish, Italian, French and Swedish. We’re seeing facilities using the algorithm and them passing it to peer facilities internationally as best practice, which is exciting. It gives every one of those facilities a shared view to work from, and corporate EHS a global perspective on spill risks.
EHS Today: Can companies that are not currently New Pig customers use it?
Andy James: Absolutely. I firmly believe anyone who goes through the process sees that we’re taking a very unbiased approach. After you receive your Spill Preparedness Report, we think you’ll see that we’re experts on understanding spill risks and preparedness... and we know just as much on the product side about making the world’s best stuff for leaks, drips and spills.
Click the green Download button below to download a sample Spill Preparedness Report.